Data dashboards with a coding agent
Updated September 25, 2026
This guide builds a one-page dashboard from a CSV export, with three charts, a table and a refresh button. Each headline number is checked against the source spreadsheet. A coding agent writes the code on a dedicated cloud machine, and the result opens at a public URL.
The example uses a sales export with a date, a product, a quantity and a revenue column. Any export with a date column and something to count works the same way.
Capture limit: the screenshots show a seeded workspace, a sample board and the first step of the codespace launcher. No dashboard was built for them. They show where each step happens, not a recorded build.
Before you start: pick three questions
Write down the three questions the dashboard must answer, for example revenue per week, the ten best-selling products, and orders per day for the last month. Export the data as sales.csv and, in the spreadsheet, work out the answer to each question for one period by hand. Those three numbers are your test.
Free includes notes, projects, 1 GB of storage (100 MB searchable) and 2,500 credits once. Codespaces are billed by the hour while they run, and the agent's AI use is a separate cost unless you bring your own API keys. Check Pricing and plans before you launch.
1. Upload the export and write the brief on a card
Add sales.csv with Upload in the workspace file list. Choose New project, name it, press Create, then Add a card on the board. The card's description is the brief:
Build a one-page dashboard in this codespace from sales.csv in the
workspace files. Columns: date, product, quantity, revenue.
Charts: revenue per week (bar), top 10 products by revenue (bar),
orders per day for the last 30 days (line).
Table: the 20 most recent rows.
Header: total revenue and order count for the selected date range,
with a date range picker that filters every chart.
Refresh: a button that re-reads sales.csv from disk.
Serve it on port 3000 and tell me the command you used. Stop for review.
Put your three hand-calculated answers in the card as a comment. You will check the dashboard against them in step 3.
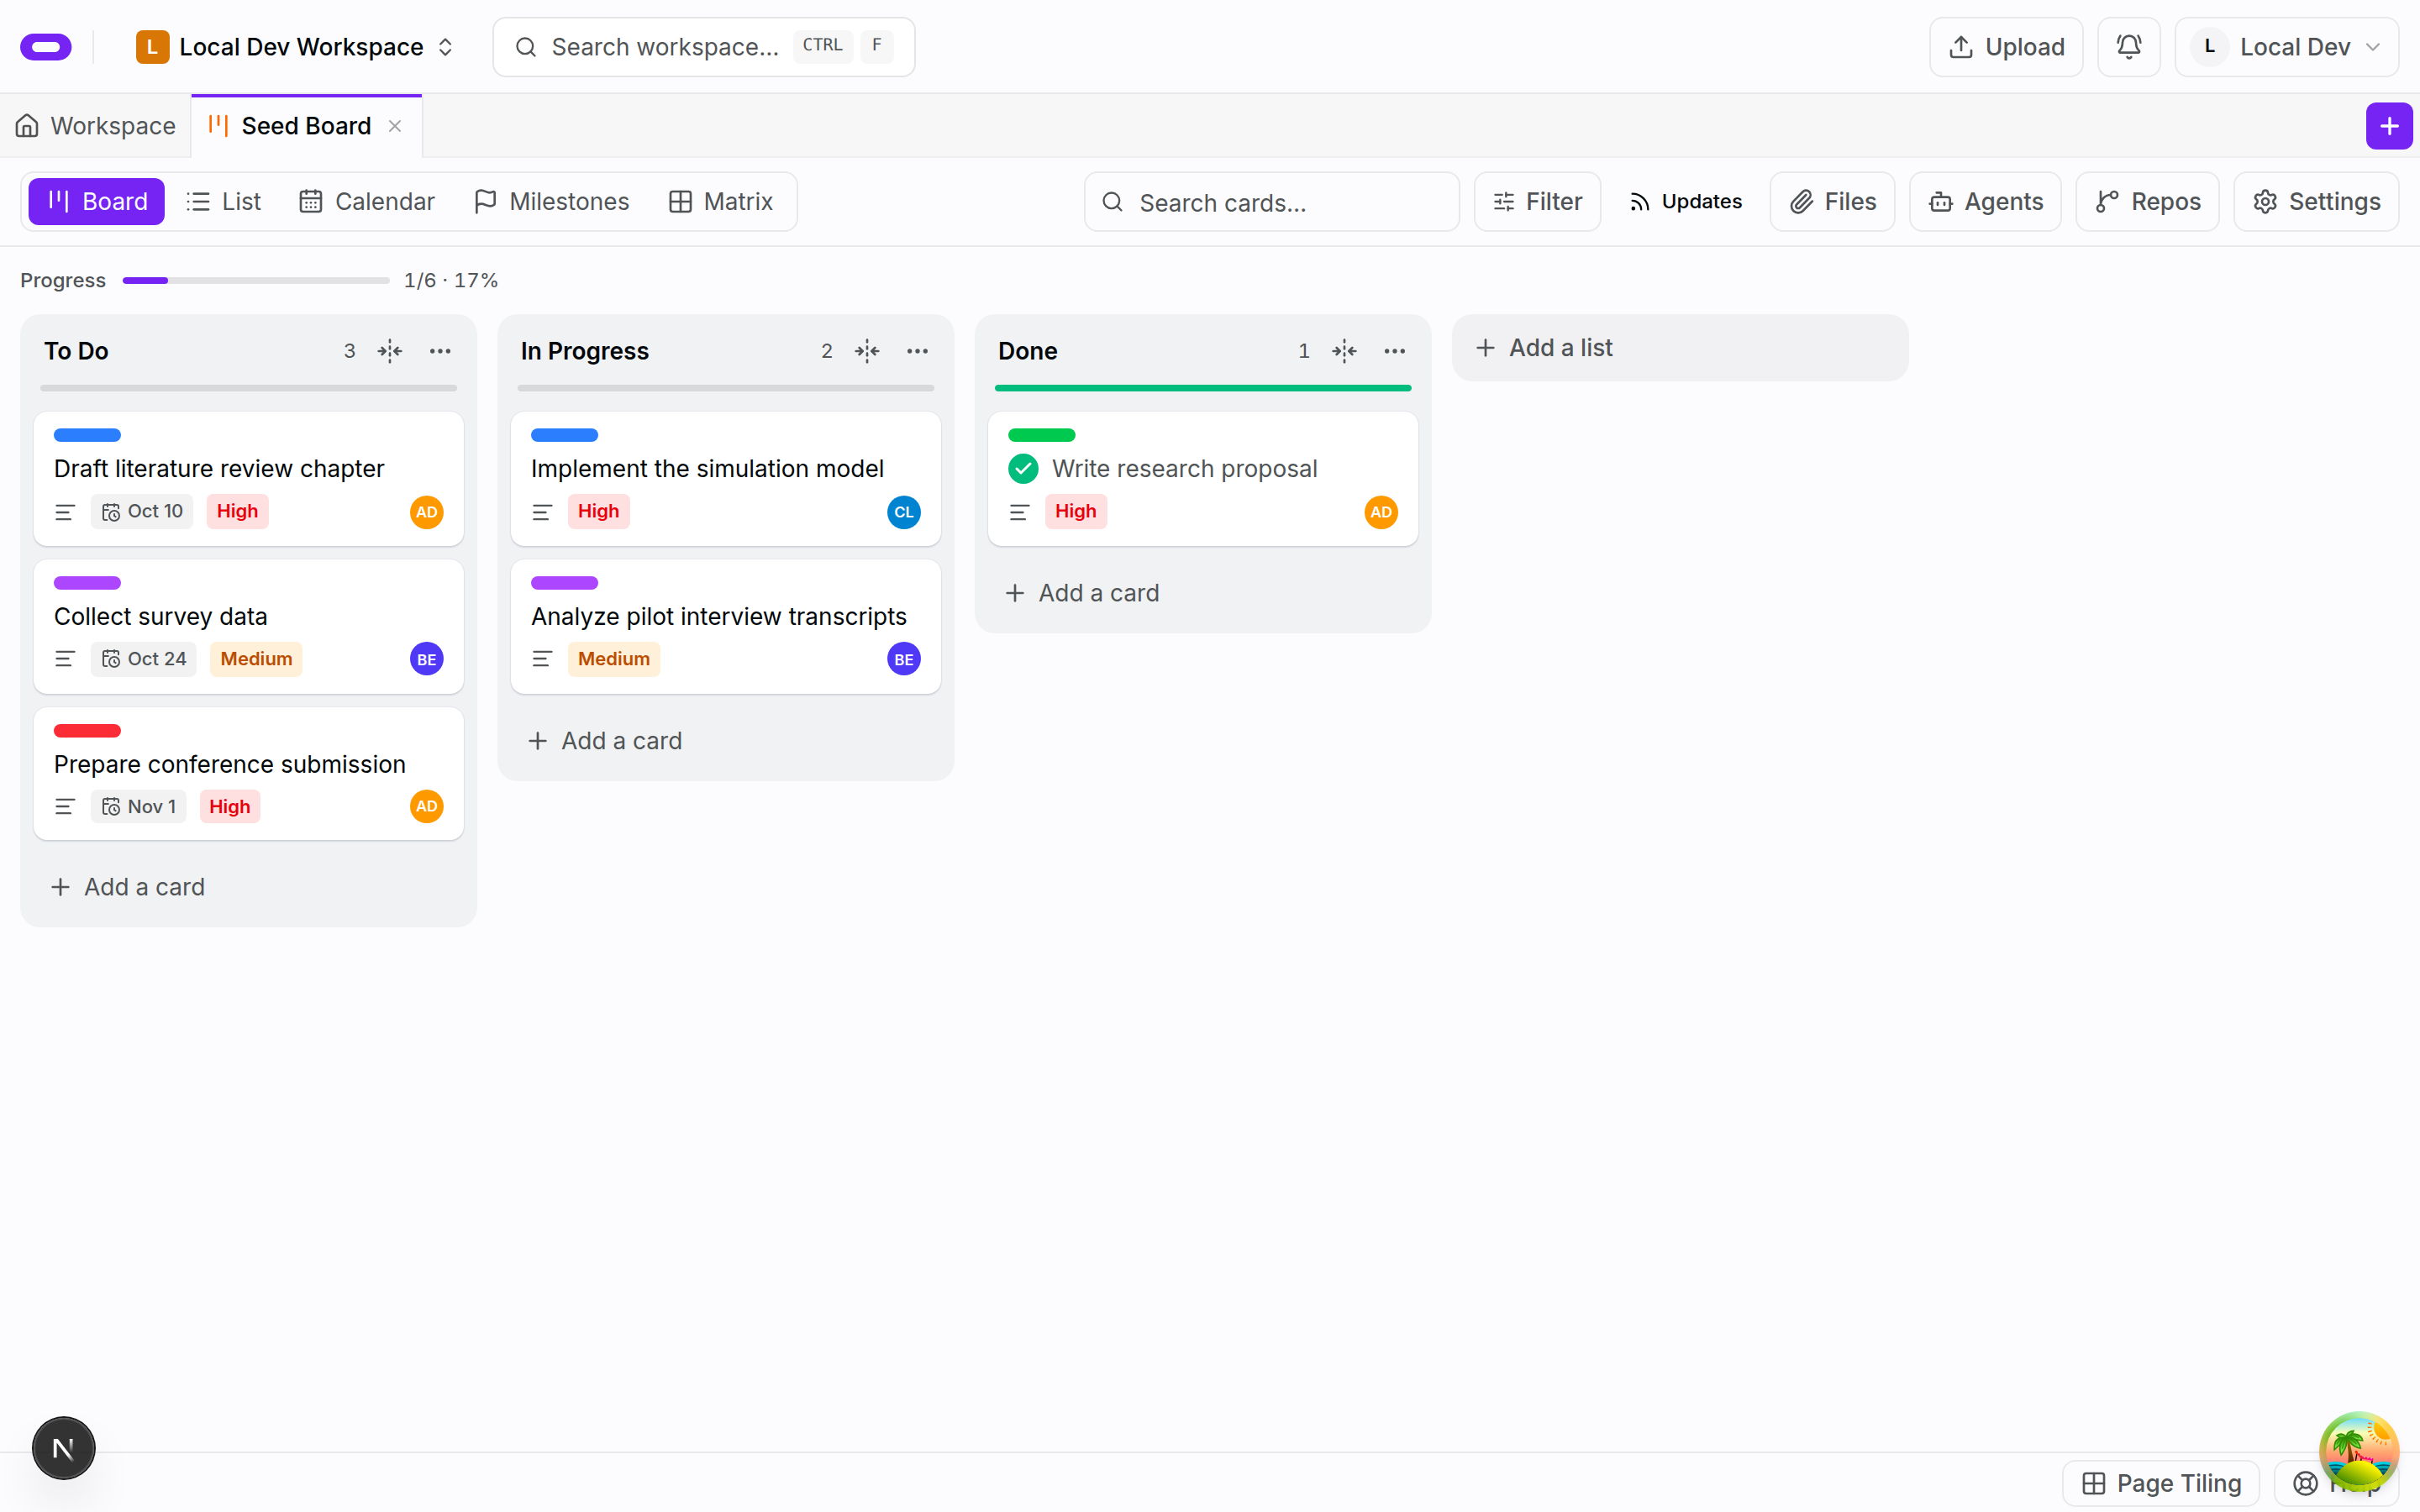
The board holds the brief and the expected numbers. The cards shown are seeded examples.
2. Launch a codespace with the workspace tools attached
Choose Codespaces from the workspace launcher. Keep Codespaces on Choose an app and skip Choose a repository (optional). On Choose your agent, pick Claude Code, Codex CLI, opencode, Cursor CLI, Qwen Code or Antigravity, then log in to it yourself or bring API keys on Authentication.
On Connect tools, attach your workspace under MCP tools. The agent needs it to read sales.csv and the card, including your expected numbers. Read AI usage budget, choose a size and runtime on Choose your machine and runtime, and paste the brief into First prompt (optional). The agent picks the charting stack, for example a small Python or Node web app with a chart library, and installs it on the machine.
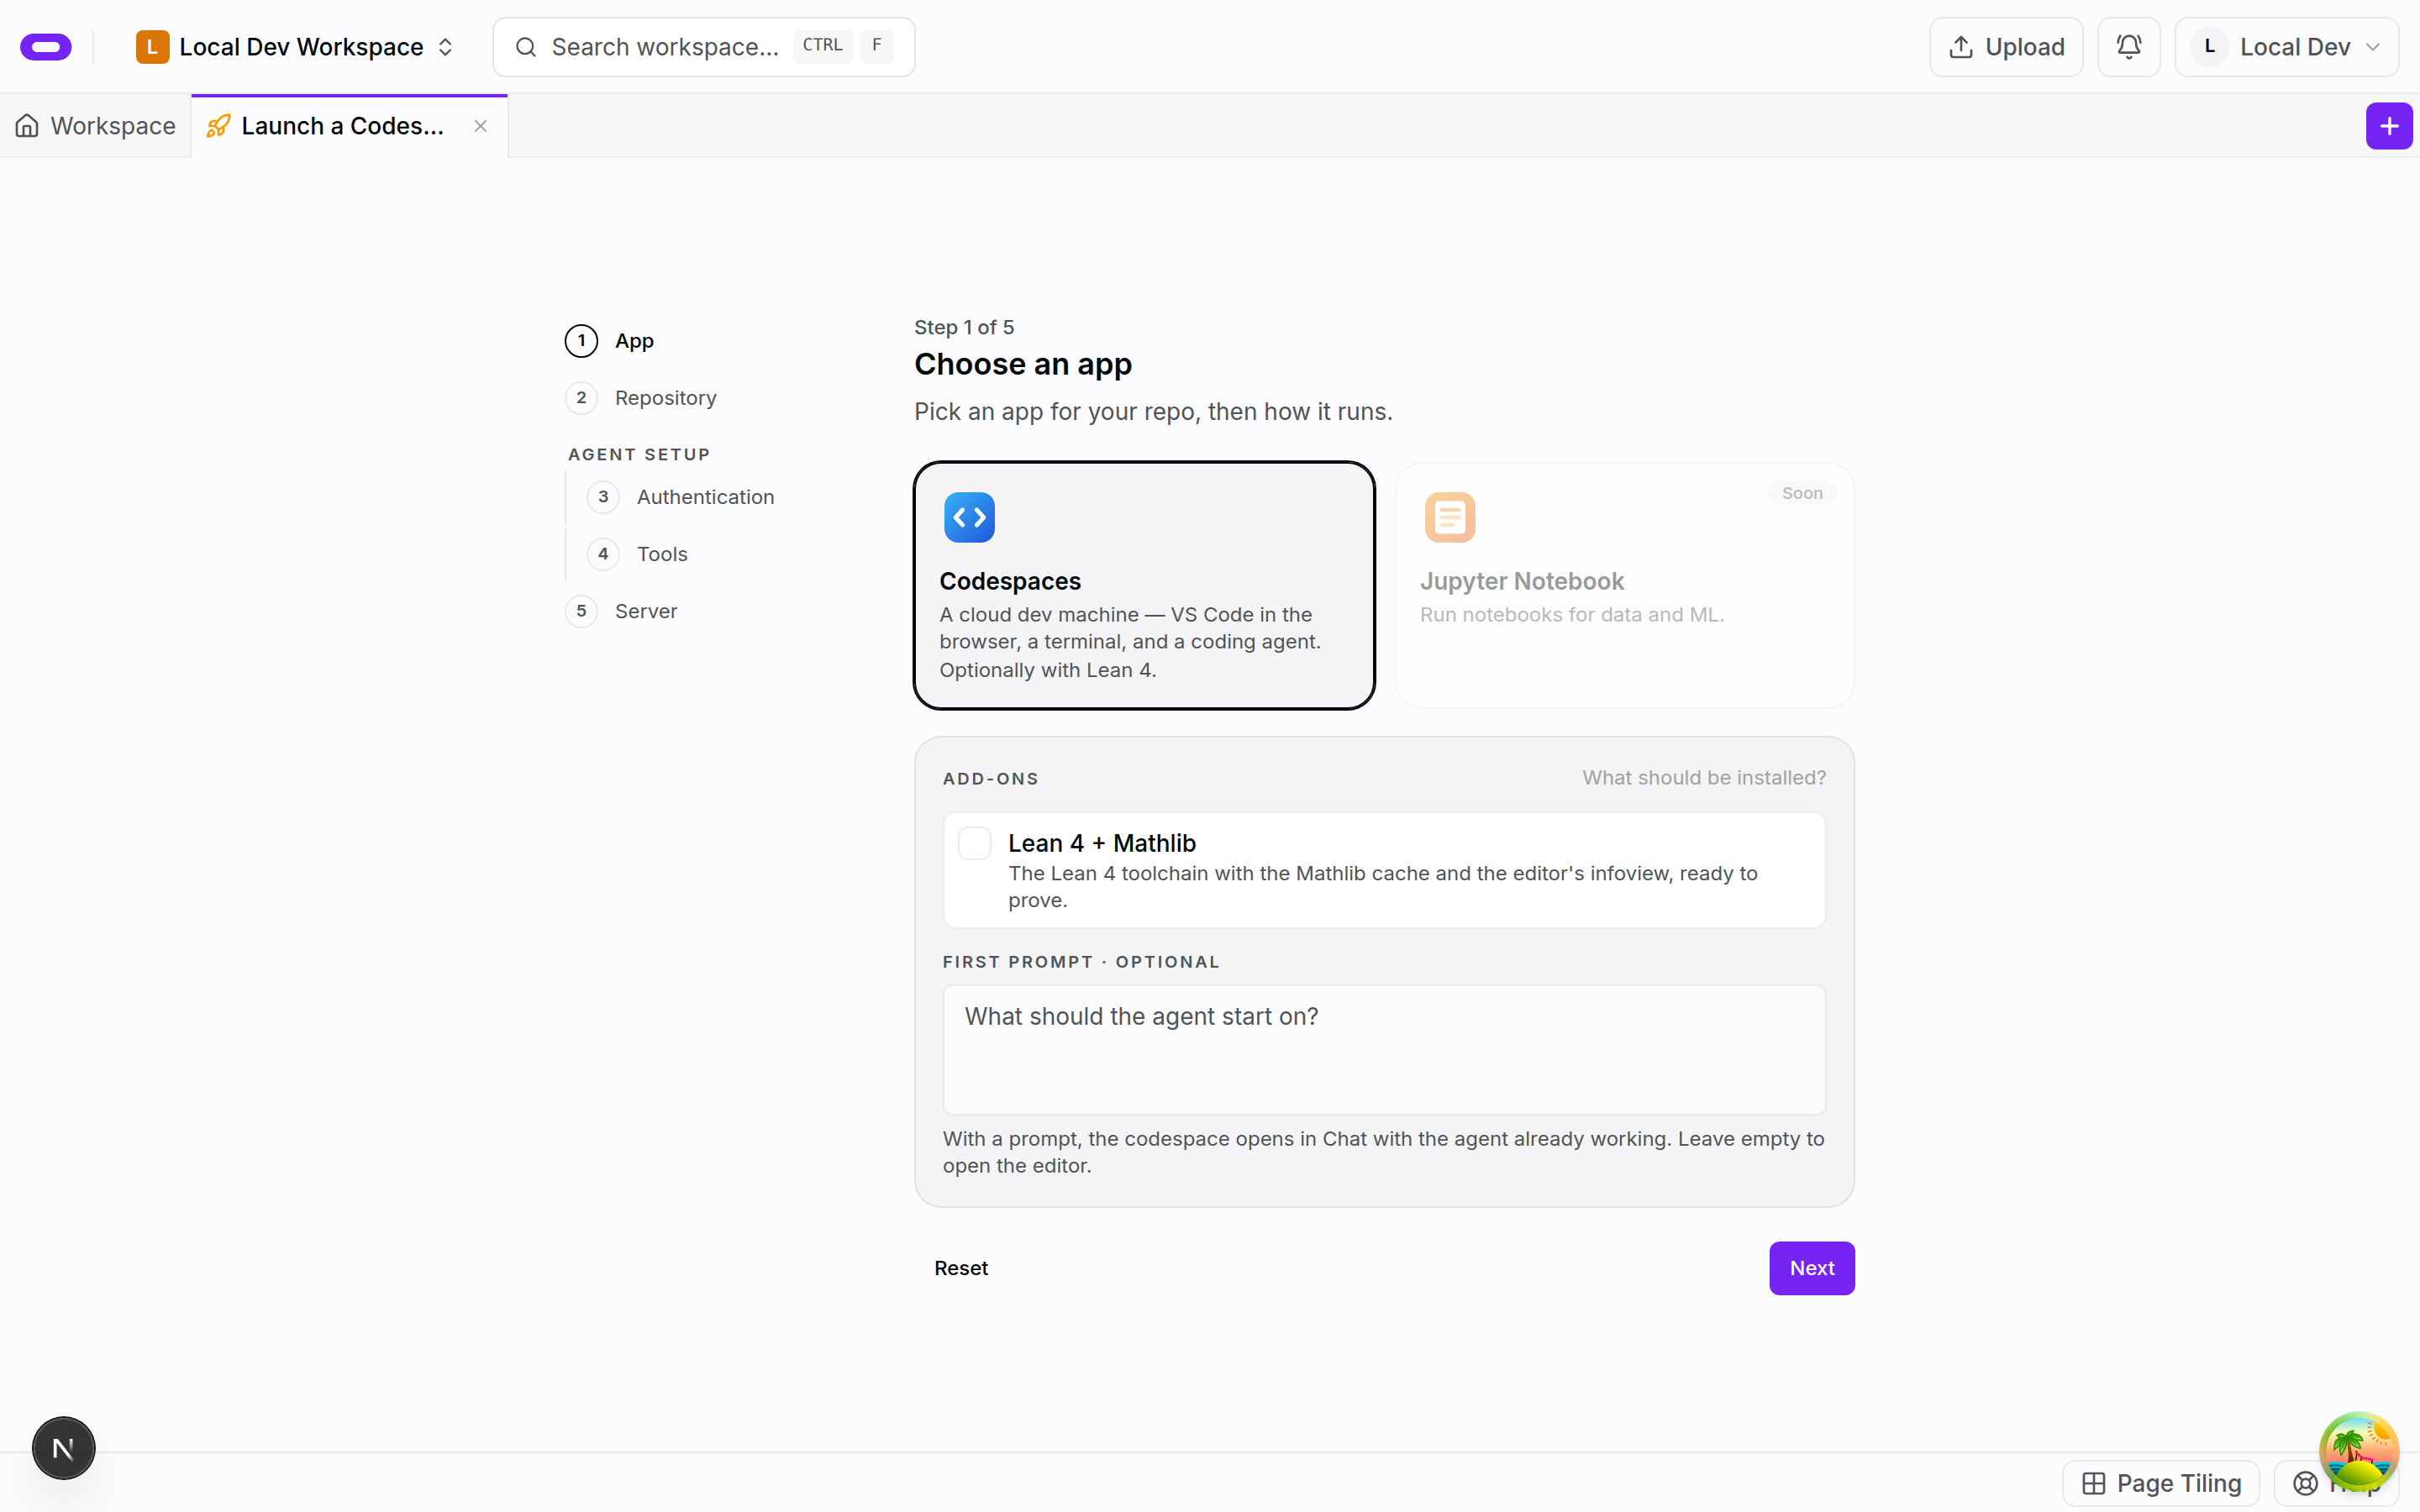
The first wizard step from a seeded workspace. No screenshot for the tools and machine steps yet.
3. Check the numbers before the charts
When the agent reports back, ignore the charts for a moment. Set the date range to the period you calculated by hand and compare the total revenue and the order count in the header with your spreadsheet. If they differ, the usual causes are a date column parsed in the wrong format, a header row counted as data, or revenue summed as text. Tell the agent which number is off and by how much.
Only then read the charts. Confirm the weekly bars cover every week in the range, the top-ten list matches the spreadsheet sort, and the daily line has no gaps that the data does not have. Open the code in VS Code in the browser or through Connect to terminal if you want to see how a chart is computed.
No screenshot for this step yet.
4. Decide who may see the numbers, then open the public URL
Every codespace has a public URL, and whatever is routed at / opens for anyone who has the link, with no login. The link is not an access control. So decide first. If the sales export is not something you would hand to a stranger, ask the agent to add a password step to the dashboard before you publish it, then confirm that the header, the charts and the table stay hidden until the password is entered. Or build the first version from a redacted or made-up export and swap in the real file only once that password step works.
With that decided, open Not published in the session header, set Route prefix to / and Port to 3000, and add the route. The button changes to Public site and the link beside it opens the dashboard. In the terminal the same command is oyren route add / 3000.
Keep secrets and API keys out of the project while the route exists. When you finish checking, remove the route with the Unpublish control in Public site or oyren route remove /, or stop the codespace.
Test the refresh path once before you rely on it. Add a few rows to the spreadsheet, export again, upload the new sales.csv to the workspace, and ask the agent to copy it onto the machine. Press the refresh button and check that the order count went up by the number of rows you added.
No screenshot for this step yet.
5. Snapshot and plan the next chart
Choose Take snapshot from the codespace card menu before Stop, since stopping deletes the machine with its files and the copy of the data on it. Runtime is billed by the hour while the codespace runs, and snapshot storage is billed monthly in credits.
Each new question is a new card: a chart per region, a comparison with the same period last year, a weekly export. Restore the snapshot, use the card's Assign to agent menu to hand the card to the agent running in your workspace, and check the new number by hand the same way.
No screenshot for this step yet.
Read what to plan before you start on the data dashboard page. If this is your first codespace, run Give a sandboxed agent its first task first. Connecting Oyren MCP servers explains what the workspace tools let the agent read. For a tool that writes data rather than charts it, see Build an internal tool with a coding agent.